STRESS - STRAIN CURVE
01Feb

The stress-strain curve is a graphical representation of the relationship between stress (force per unit area) and strain (deformation per unit length) in a material. It is fundamental in materials science and mechanical engineering for understanding material behaviour under loading conditions.
Key Regions of the Stress-Strain Curve
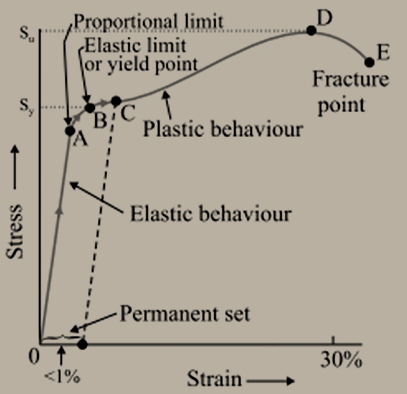
- Proportional Limit: (O to A)
- The initial straight-line region where stress and strain have a linear relationship (Hooke's law is obeyed, This famous law of physics was given by a well-known physicist Robert Hooke. The relationship between “stress and strain” is shown by “Hooke’s Law”. According to the statement of Hooke’s law, “for small deformations, stress shows direct proportionality to strain. Thus Stress ∝ Strain Or, Stress = E × Strain Where E is defined as the constant of proportionality and is known as the Modulus of Elasticity. Hooke’s law for stress and strain is valid for all the material. It is an empirical law).
- The material behaves elastically, meaning it returns to its original shape when the load is removed.
- Elastic Region: (A to B)
- In this region the stress applied and strain produced are not proportional to each other Up to the elastic limit (yield point), the material deforms elastically and fully recovers when unloaded. This region is characterized by reversible deformation.
- The point B-The point B in the curve is known as the yield point or the elastic limit of the curve. The tensile stress corresponding to the yield point is named yield stress . Further, as we increase the load, the stress starts exceeding the yield stress. This means now even if there is a small change in stress, the strain will increase rapidly.
- Region B to D In this region, the strain increases very quickly even if we change the stress by a small amount. If we withdraw the exerted force at point C between B and D, the body will not return to its initial dimension. Hence, we can conclude that if the applied tensile stress is null, the strain will not be equal to zero. This is a deformation produced in the body, and we call this deformation plastic deformation. At this point, the material is said to have a permanent set.
- The point D and E- In the graph, the “D point” is called the “ultimate tensile strength of the material”. Beyond point D, additional strain is produced in the material; even if the applied tensile strength is reduced, fracture occurs. Point E is defined as a fracture point.
If the distance between point E and point D is not much, then the material is called brittle material. If point E and point D are far apart from each other, then the material is known as ductile material. The stress-strain curve depends upon the material and varies from material to material. For example, the stress-strain curve for ductile material is different from the curve for the brittle material.
The curve shown above in figure is the stress-strain curve for a ductile material. Some examples of ductile materials are – copper, aluminium, and magnesium alloys.
Brittle material is defined as the material which shows very small elongation before reaching the fracture point.
For example – high carbon steel and concrete.
The permanent elongation is less than 10% in the stress-strain curves for brittle material.
Stress-Strain Curves for Different Materials
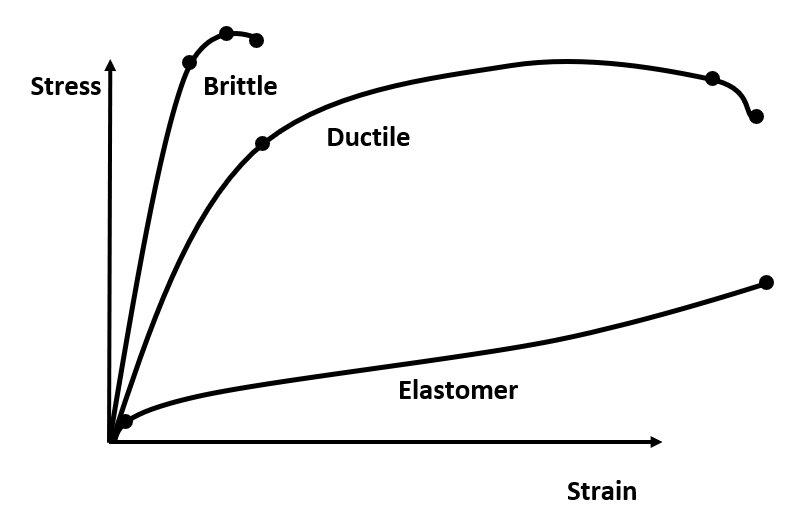
The stress-strain curve varies significantly depending on the type of material. Here’s how it looks for ductile materials, brittle materials, and elastomers:

1. Ductile Materials (e.g., Steel, Aluminum, Copper)
- Characteristics:
- Shows an initial linear elastic region (obeys Hooke’s Law).
- Has a well-defined yield point where plastic deformation begins.
- Undergoes strain hardening, where it continues to deform before reaching ultimate tensile strength (UTS).
- After UTS, the material experiences necking before fracture.
- Exhibits high plastic deformation before breaking.
- Example: Mild steel
- Used in: Structural applications, automotive, and aerospace.
2. Brittle Materials (e.g., Glass, Ceramics, Cast Iron)
- Characteristics:
- The curve is nearly linear until fracture.
- No significant plastic deformation; material breaks suddenly after reaching the ultimate tensile strength.
- No yield point or strain hardening.
- High strength but low ductility (i.e., it cannot elongate much before breaking).
- Example: Glass
- Used in: Construction, electronics, and tools.
3. Elastomers (e.g., Rubber, Silicone, Polymers)
- Characteristics:
- Shows a highly nonlinear stress-strain relationship.
- Exhibits extreme elasticity (returns to original shape after large deformation).
- No clear yield point; instead, it can stretch several times its original length before failing.
- Fractures at very high strain values.
- Example: Natural rubber
- Used in: Tires, seals, and medical devices.
Comparison of Stress-Strain Curves
- Ductile Materials: Long curve with a clear yield point and large plastic deformation before fracture.
- Brittle Materials: Shorter curve with little to no plastic deformation and sudden fracture.
- Elastomers: Very long curve with large strain values and significant recoverable deformation.
Comments